10 Learning analytics metrics
Organizations can get valuable insights into how effective their training programs are by keeping tabs on learning analytics metrics. They can pinpoint where improvements are needed, and most importantly, make smart decisions based on data to level up their team’s development. So, in this article, we’re going to take a look at ten important metrics that you should take note of.
1. Completion Rate
One important learning analytics metric is the completion rate, which measures the percentage of learners who successfully complete a course or program. This metric gives you a solid idea of how engaged your learners are. Plus, it helps you spot those courses or modules that might need a little sprucing up to get more learners to cross that finish line.
So, when you crunch those completion rate numbers, you're arming yourself with the info you need to make smart decisions. You can beef up your course content, try different delivery methods, or even fine-tune your engagement strategies. It's all about using the data to make things better.

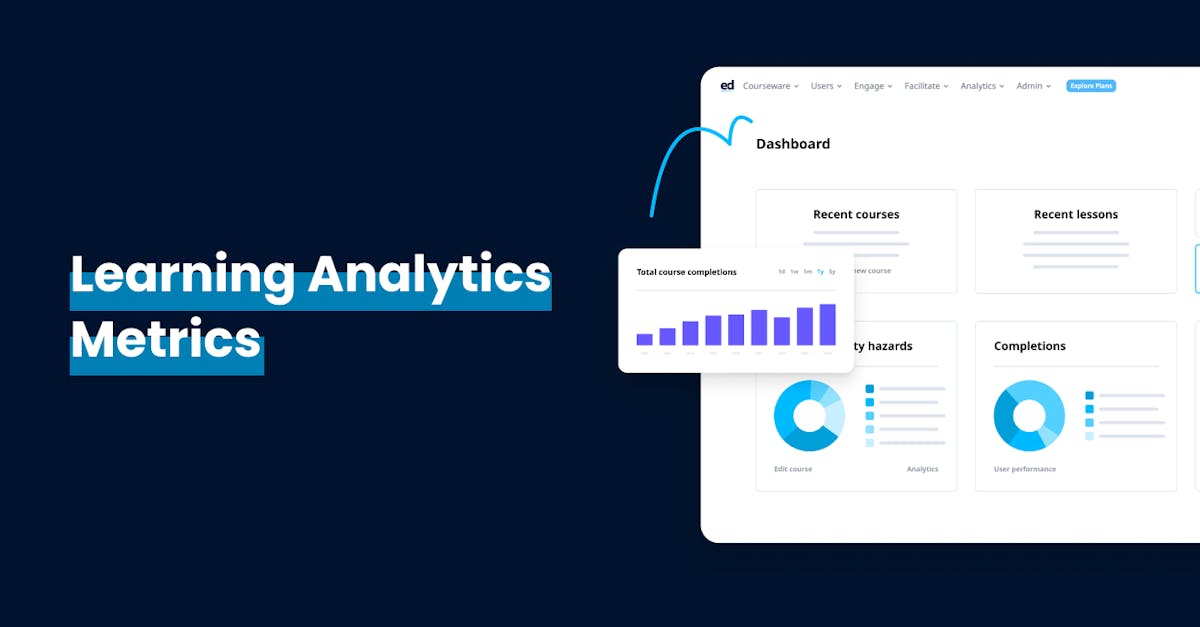
Nowadays, many online training platforms offer built-in learning analytics dashboards that measure course completion rates. EdApp is one example of this. Through their performance dashboard feature, you can view and export training reports that can help you track your team’s completion rates in real time.
Try EdApp at no cost and start keeping track of your team's learning analytics metrics!
2. Time to Completion
Time to completion is a way of measuring how long it takes for learners to finish a course or program on average. This metric is like a secret detective that gives you insights into the effectiveness of your learning materials and how engaged your learners are.

If it takes a long time for folks to complete the course, it might mean that the content is too complex or there's just way too much of it. And that can lead to learner fatigue or a serious case of disinterest. On the flip side, if your team members zip through the material super quickly, it might mean that it lacks depth or that they're not fully engaged.
So, by crunching the numbers and analyzing the time to completion, you can fine-tune your learning materials and make them even better. That way, you’ll be able to optimize engagement and make sure that knowledge really sticks with your team.
3. Knowledge Gain
Knowledge gain is another crucial learning analytics metric that assesses the increase in knowledge or skills acquired by learners after completing a course or training program. Basically, it's a metric that tells you how much your team members have leveled up.

So, how can you measure it? Well, you’ve got a lot of options! You can use assessments, quizzes, or even pre- and post-tests to get the data. By measuring knowledge gain, businesses can assess the effectiveness of their learning initiatives and identify areas where learners may need additional support or resources. It also helps in evaluating the impact of training on individual and organizational performance.
4. Engagement Level
Another important metric in the world of learning analytics is engagement level. In a nutshell, it measures just how much learners are interacting and participating in a course or program. Think of it as a gauge of their excitement and involvement.

To measure it, you can look at things like forum participation, discussion board contributions, or even how much they're using interactive elements within the learning material. It's all about getting a sense of how engaged they truly are.
High engagement levels are like fireworks, signaling active participation and genuine interest. As trainers and managers, this is what you want to see. On the other hand, low engagement levels might suggest a lack of interest or relevance. But don’t worry, this is where this learning analytics metric really comes in handy.
When you track engagement levels, you can spot those areas that need some extra love and make the overall learning experience even better for your team. It's all about fine-tuning, looking at different employee engagement ideas, and creating an experience that truly hooks your learners.
EdApp’s Analytics Suite lets you see how your learners interact with any course, including engagement with any gamification elements. Through the platform, you can even drill down into your team’s progress through more focused dashboards like login analytics and slide-level analytics.
5. Performance Improvement
Performance improvement evaluates the impact of learning initiatives on individual and organizational performance. It measures the extent to which your learners apply their acquired knowledge or skills in their job roles and the subsequent improvement in their performance.

By assessing performance improvement, you can gain valuable insights into the effectiveness of your training programs. You’ll also have a chance to identify areas of success as well as areas that may require further attention.
This metric allows your business to track the tangible impact of your training on employee performance, such as increased productivity, enhanced job satisfaction, and improved customer satisfaction.
Also, when businesses understand how learning affects performance improvement, they can make smart choices about future training investments. They can customize learning programs to fill specific skill gaps or tackle performance challenges head-on.
6. Retention Rate
Retention rate is a nifty metric that measures the percentage of learners who stick around and keep engaging with learning materials or programs for a specific period of time. It's like a report card for how well you're keeping your learners hooked.

A high retention rate is like a high-five from your learners. It shows that they find the content valuable and they're all pumped up to keep on their learning journey. It's like a badge of honor! But on the flip side: if the retention rate is low, it's a sign that you might have some factors pushing learners to drop out.
But by tracking the retention rate, you can spot those factors and take proactive measures to turn things around. This way, you can boost engagement and keep your learners on a path of growth and development.
A great way to check if your team is retaining any information is to give them quizzes and assessments. EdApp is a learning analytics software that offers its own online quiz maker called Rapid Refresh. This feature can help make your assessment process much easier. With just a few clicks, you can set up a gamified quiz and automatically send it to your team - all within a few minutes.

7. Social Interaction
You can measure how much your team members collaborate and share knowledge with each other through a social interaction metric. Think about it in terms of group discussions, giving feedback to peers, or even joining forces for awesome collaborative projects. When you see high social interaction, it means you've got an active learning community going on, where everyone feels like they belong and they're super motivated to learn.
Additionally, by promoting social interaction, you can take your team’s learning experience to a whole new level. You can create a welcoming environment where employees can come together, share their knowledge, and learn from each other.
It's all about building a learning community that's full of energy, excitement, and a whole lot of teamwork. So, a big tip here is to encourage that social interaction through online tools like EdApp’s Discussions feature.

Through its forum-like functionality, you can boost your team’s ideas and handy suggestions. Watch the magic happen as your learners can effortlessly exchange knowledge with you and their fellow peers through text, images, and videos.
8. Assessment Performance
In the realm of employee training, assessment performance plays an important role in measuring team members’ level of understanding and proficiency. It serves as a measuring stick for evaluating how well learners perform on assessments or quizzes that are directly related to the learning material.

By analyzing assessment performance, businesses can identify areas where learners may need additional support or where the learning material requires clarification or improvement. This metric helps organizations ensure that their training programs effectively transfer knowledge to learners.
9. Return on Investment (ROI)
This learning analytics metric plays a huge role in helping businesses figure out the financial impact of all their training initiatives. To put it in simpler terms, it measures how much value you're getting out of the training compared to all the money and resources you put into it. This includes things like the cost of the program, the time your staff spends on it, and all the other expenses that come with training employees.

When you calculate the ROI, you can see just how effective and cost-efficient your learning and development programs really are. It's a handy tool for businesses to make smart decisions about where to put their resources and prioritize the initiatives that give them the biggest bang for their buck.
10. Learner Satisfaction
Learner satisfaction is a training metric that gauges learners' subjective perception of the learning experience. It can be measured through surveys or feedback forms. Assessing learner satisfaction gives insights into the effectiveness of the learning materials, delivery methods, and overall learning environment.

By collecting feedback from learners, organizations can identify areas for improvement and enhance the learning experience to meet learners' needs and expectations. Think about it - when learners are satisfied, they're more engaged, motivated, and likely to retain the knowledge they've gained. Plus, it helps organizations align their learning initiatives with what their learners actually want and need.
Author
Hannah Malmstrom
Hannah is an eLearning writer who dedicates her time to creating in-depth content about EdApp, a multi-award-winning mobile LMS that has pioneered one of the most progressive microlearning solutions on the market. She brings years of writing experience in the online software industry to her current role in the eLearning sphere. When she's not writing, you can find her catching up on new anime series or re-reading her favorite novels.